Generate a numbered list starting from 1.

Each line must contain the number followed by a short random English sentence.

Example format:
1. The sky above the city slowly turned orange at sunset.
2. A small robot carefully sorted books on the wooden shelf.

Continue increasing the number and writing new sentences.

Do not stop. Continue until the maximum token limit is reached.M1Pro/M5Pro 芯片 MacBook Pro 性能评测
EpLiar
3月 13, 2026
前言
从 M1 Pro 购入到 M5 Pro 购入大概过去了四年五个月的时间,这期间迭代了很多款 M 系芯片。从 coding agent 出现后对于我的工作负载来说也还算够用,但最后还是决定购入 M5 Pro。趁着 M1 Pro 还没转手的这几天,撰写此文,以充分发挥 M1 Pro 的最后一点余温。
测试环境变量
一些介绍游戏打法的视频通常都会为了介绍容错性而故意/无意地进行防水,本文也不例外,测试环境在同一条件的情况下为 M5 Pro 的 MacBook Pro 新增了以下 Debuff:
-
落地扇会先吹到 M1 Pro 再吹它,也就是它在下风向
-
它比 M1 Pro 的后台多跑了包括但不限于微信、Telegram 和 Discord
-
它的电源是来自一根台式电脑 Type-A 接出来的 Type-C 数据线,M1 Pro 是 Anker 桌面充电器 (140W Port)
-
M1 Pro 关闭背光键盘,它打开
接下来,就看看测试结果吧
开始测试
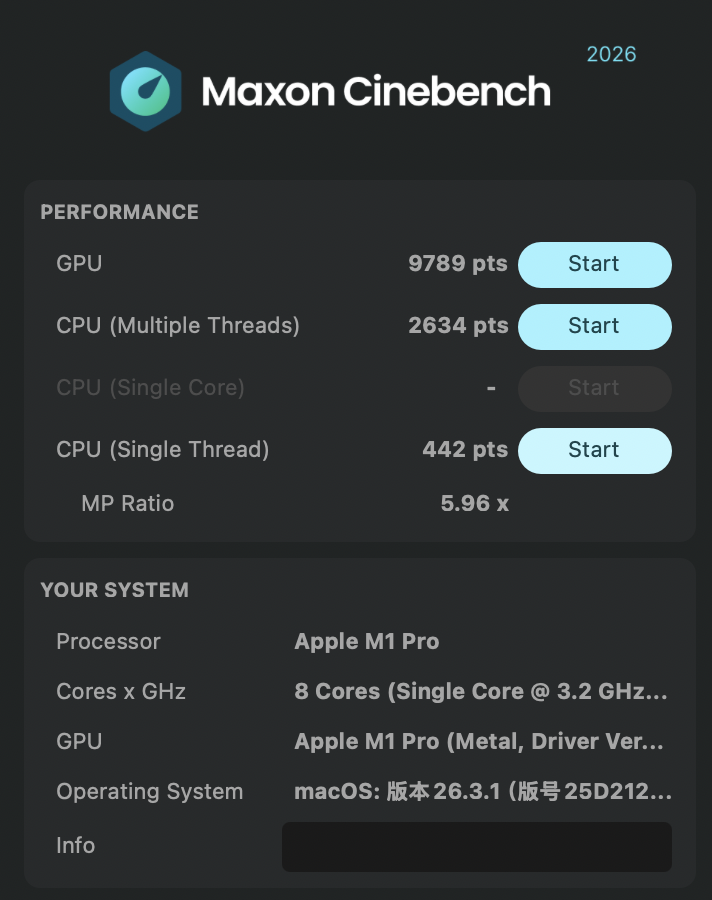
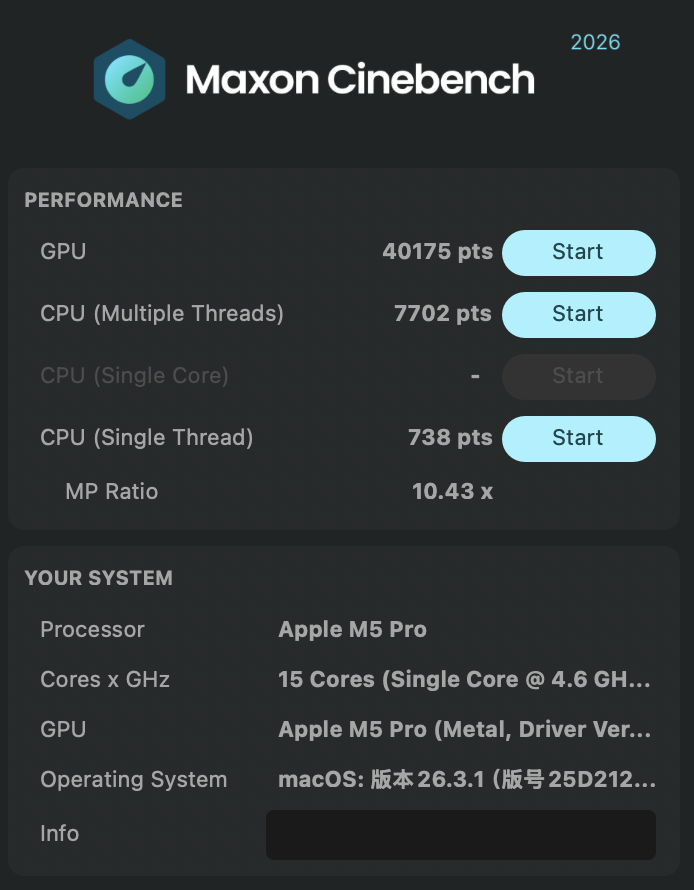
Cinebench
测试使用版本:Cinebench 2026,gsha1sum 哈希值:b64b07dcd1fb0209c806350eed1dc70a4f29ea87 Cinebench2026_macOS.dmg
| 型号 | 测试项目 | 分数 | 变化 |
|---|---|---|---|
M1Pro |
GPU |
9789 |
|
M5Pro |
GPU |
40175 |
+30386 |
M1Pro |
CPU (Multiple Threads) |
2634 |
|
M5Pro |
CPU (Multiple Threads) |
7702 |
+5068 |
M1Pro |
CPU (Single Thread) |
442 |
|
M5Pro |
CPU (Single Thread) |
738 |
+296 |
M1Pro |
MP Ratio |
5.96 |
|
M5Pro |
MP Ratio |
10.43 |
+4.47 |
LM Studio (大模型 Token/s 测试)
此测试将使用两个模型:google/gemma-3-4b 和 qwen/qwen3.5-9b,测试结果均遇到「停止原因:检测到 EOS Token」
测试提示词
google/gemma-3-4b
| 型号 | Token/s | Token 用量 | TTFT |
|---|---|---|---|
M1Pro |
49.03 |
1260 |
0.83s |
M5Pro |
96.79 |
1379 |
0.24s |
qwen/qwen3.5-9b
| 型号 | Token/s | Token 用量 | TTFT |
|---|---|---|---|
M1Pro |
16.2 |
2465 |
1.32s |
M5Pro |
34.78 |
3672 |
0.71s |
ffmpeg 视频合成
HDR 10 样片来自于影视飓风的 YouTube:【HDR10】我们用一年拍下了这些样片…
ffmpeg 版本信息
ffmpeg version 8.0.1 Copyright (c) 2000-2025 the FFmpeg developers
  built with Apple clang version 17.0.0 (clang-1700.6.3.2)
  configuration: --prefix=/opt/homebrew/Cellar/ffmpeg/8.0.1_4 --enable-shared --enable-pthreads --enable-version3 --cc=clang --host-cflags= --host-ldflags= --enable-ffplay --enable-gpl --enable-libsvtav1 --enable-libopus --enable-libx264 --enable-libmp3lame --enable-libdav1d --enable-libvpx --enable-libx265 --enable-openssl --enable-videotoolbox --enable-audiotoolbox --enable-neon
  libavutil      60.  8.100 / 60.  8.100
  libavcodec     62. 11.100 / 62. 11.100
  libavformat    62.  3.100 / 62.  3.100
  libavdevice    62.  1.100 / 62.  1.100
  libavfilter    11.  4.100 / 11.  4.100
  libswscale      9.  1.100 /  9.  1.100
  libswresample   6.  1.100 /  6.  1.100
Universal media converter
下载/合成过程
$ yt-dlp -f 251 https://www.youtube.com/watch\?v\=itCWAiMWBgM --cookies-from-browser chrome
$ yt-dlp -f 701 https://www.youtube.com/watch\?v\=itCWAiMWBgM --cookies-from-browser chrome
$ ffmpeg -i "【HDR10】我们用一年拍下了这些样片… [itCWAiMWBgM].mp4" -i "【HDR10】我们用一年拍下了这些样片… [itCWAiMWBgM].webm" 我们用一年拍下了这些样片….mp4
Input #0, mov,mp4,m4a,3gp,3g2,mj2, from '【HDR10】我们用一年拍下了这些样片… [itCWAiMWBgM].mp4':
  Metadata:
    major_brand     : dash
    minor_version   : 0
    compatible_brands: iso6av01mp41
    creation_time   : 2026-02-16T01:59:50.000000Z
  Duration: 00:03:38.62, start: 0.000000, bitrate: 20907 kb/s
  Stream #0:0[0x1](und): Video: av1 (libdav1d) (Main) (av01 / 0x31307661), yuv420p10le(tv, bt2020nc/bt2020/smpte2084), 3840x2160, 20303 kb/s, 29.97 fps, 29.97 tbr, 30k tbn (default)
    Metadata:
      creation_time   : 2026-02-16T01:59:50.000000Z
      handler_name    : ISO Media file produced by Google Inc.
      vendor_id       : [0][0][0][0]
    Side data:
      Mastering Display Metadata, has_primaries:1 has_luminance:1 r(0.6800,0.3200) g(0.2650,0.6900) b(0.1500 0.0600) wp(0.3127, 0.3290) min_luminance=0.005000, max_luminance=1000.000000
Input #1, matroska,webm, from '【HDR10】我们用一年拍下了这些样片… [itCWAiMWBgM].webm':
  Metadata:
    encoder         : google/video-file
  Duration: 00:03:38.62, start: -0.007000, bitrate: 122 kb/s
  Stream #1:0(eng): Audio: opus, 48000 Hz, stereo, fltp, start -0.007000 (default)
Stream mapping:
  Stream #0:0 -> #0:0 (av1 (libdav1d) -> h264 (libx264))
  Stream #1:0 -> #0:1 (opus (native) -> aac (native))
Press [q] to stop, [?] for help
[libx264 @ 0xca6c31180] using SAR=1/1
[libx264 @ 0xca6c31180] using cpu capabilities: ARMv8 NEON DotProd I8MM
[libx264 @ 0xca6c31180] profile High 10, level 5.1, 4:2:0, 10-bit
[libx264 @ 0xca6c31180] x264 - core 165 r3222 b35605a - H.264/MPEG-4 AVC codec - Copyleft 2003-2025 - http://www.videolan.org/x264.html - options: cabac=1 ref=3 deblock=1:0:0 analyse=0x3:0x113 me=hex subme=7 psy=1 psy_rd=1.00:0.00 mixed_ref=1 me_range=16 chroma_me=1 trellis=1 8x8dct=1 cqm=0 deadzone=21,11 fast_pskip=1 chroma_qp_offset=-2 threads=22 lookahead_threads=3 sliced_threads=0 nr=0 decimate=1 interlaced=0 bluray_compat=0 constrained_intra=0 bframes=3 b_pyramid=2 b_adapt=1 b_bias=0 direct=1 weightb=1 open_gop=0 weightp=2 keyint=250 keyint_min=25 scenecut=40 intra_refresh=0 rc_lookahead=40 rc=crf mbtree=1 crf=23.0 qcomp=0.60 qpmin=0 qpmax=81 qpstep=4 mastering-display=G(13248,34500)B(7500,3000)R(34000,16000)WP(15635,16450)L(10000000,50) ip_ratio=1.40 aq=1:1.00
Output #0, mp4, to '我们用一年拍下了这些样片….mp4':
  Metadata:
    major_brand     : dash
    minor_version   : 0
    compatible_brands: iso6av01mp41
    encoder         : Lavf62.3.100
  Stream #0:0(und): Video: h264 (avc1 / 0x31637661), yuv420p10le(tv, bt2020nc/bt2020/smpte2084, progressive), 3840x2160 [SAR 1:1 DAR 16:9], q=2-31, 29.97 fps, 30k tbn (default)
    Metadata:
      encoder         : Lavc62.11.100 libx264
      creation_time   : 2026-02-16T01:59:50.000000Z
      handler_name    : ISO Media file produced by Google Inc.
      vendor_id       : [0][0][0][0]
    Side data:
      Mastering Display Metadata, has_primaries:1 has_luminance:1 r(0.6800,0.3200) g(0.2650,0.6900) b(0.1500 0.0600) wp(0.3127, 0.3290) min_luminance=0.005000, max_luminance=1000.000000
      cpb: bitrate max/min/avg: 0/0/0 buffer size: 0 vbv_delay: N/A
  Stream #0:1(eng): Audio: aac (LC) (mp4a / 0x6134706D), 48000 Hz, stereo, fltp, 128 kb/s (default)
    Metadata:
      encoder         : Lavc62.11.100 aac
测试结果:
-
M1 Pro:elapsed=0:06:33.60
-
M5 Pro:elapsed=0:02:45.39,提升 ≈ 57.98%
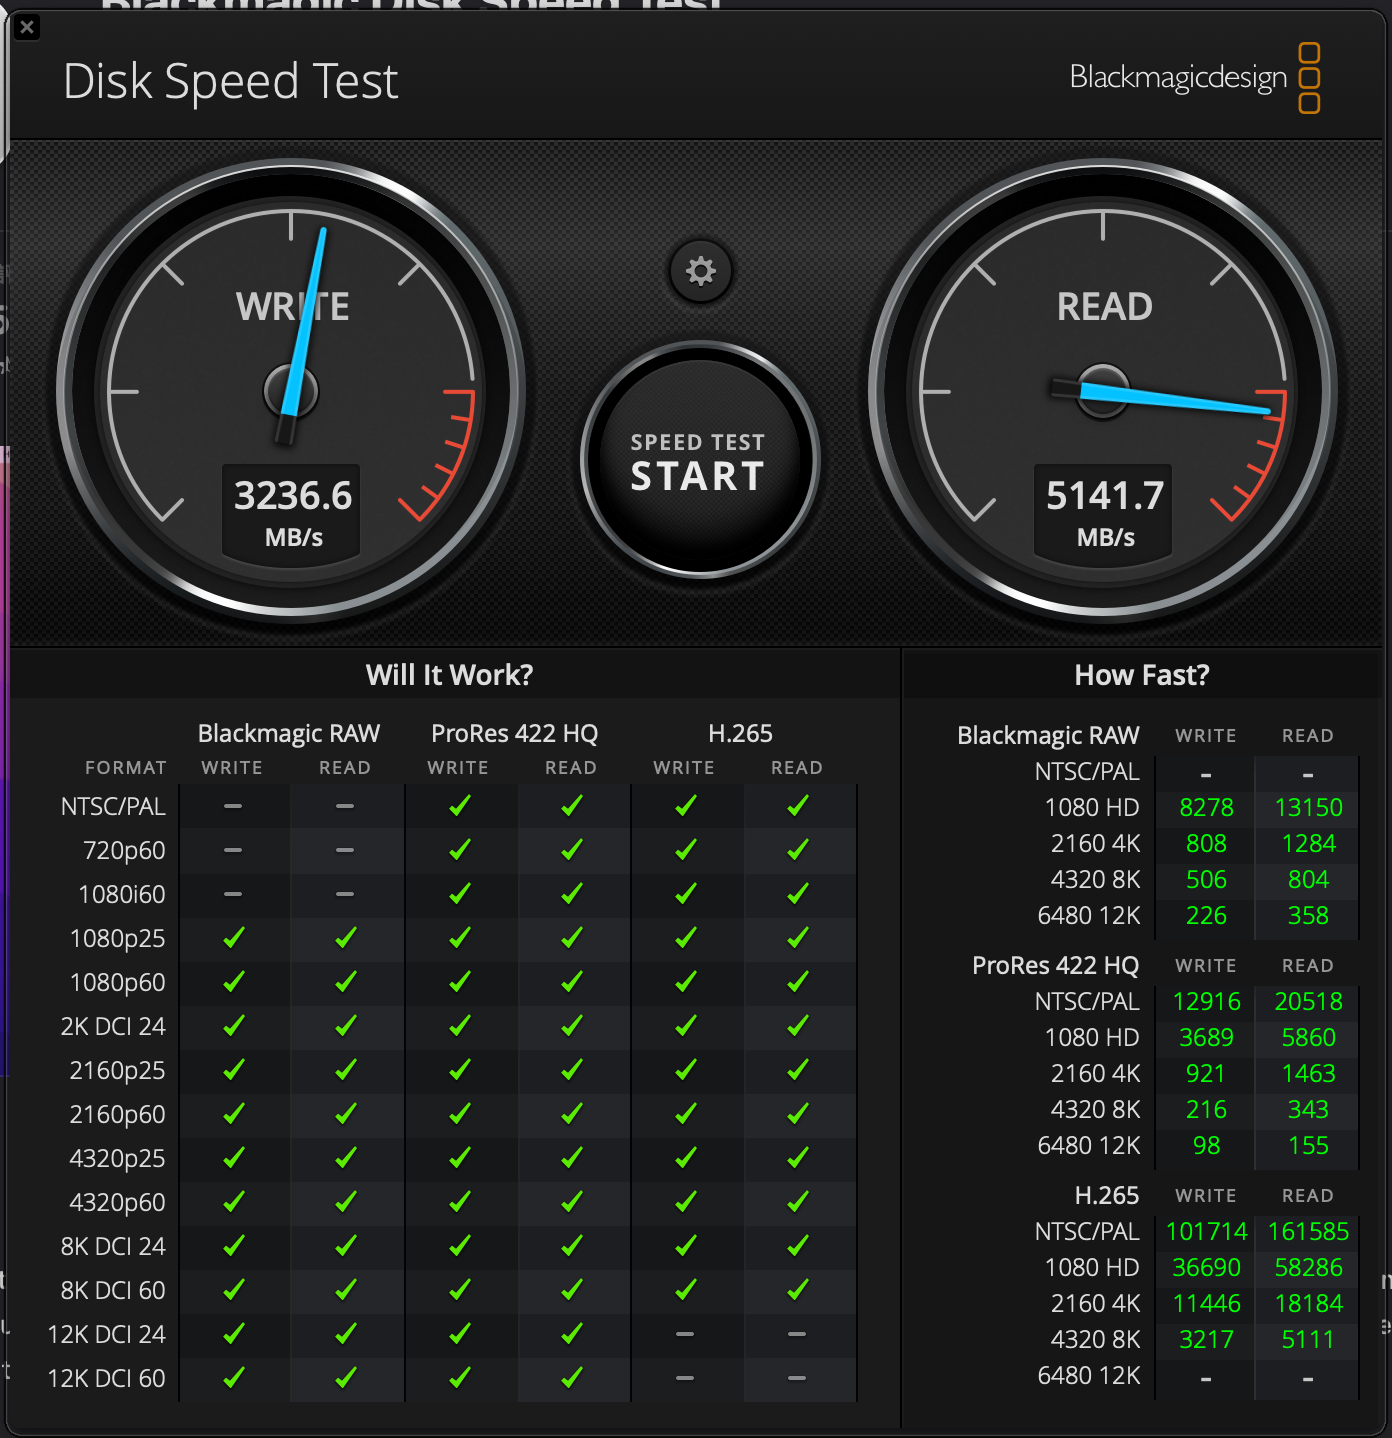
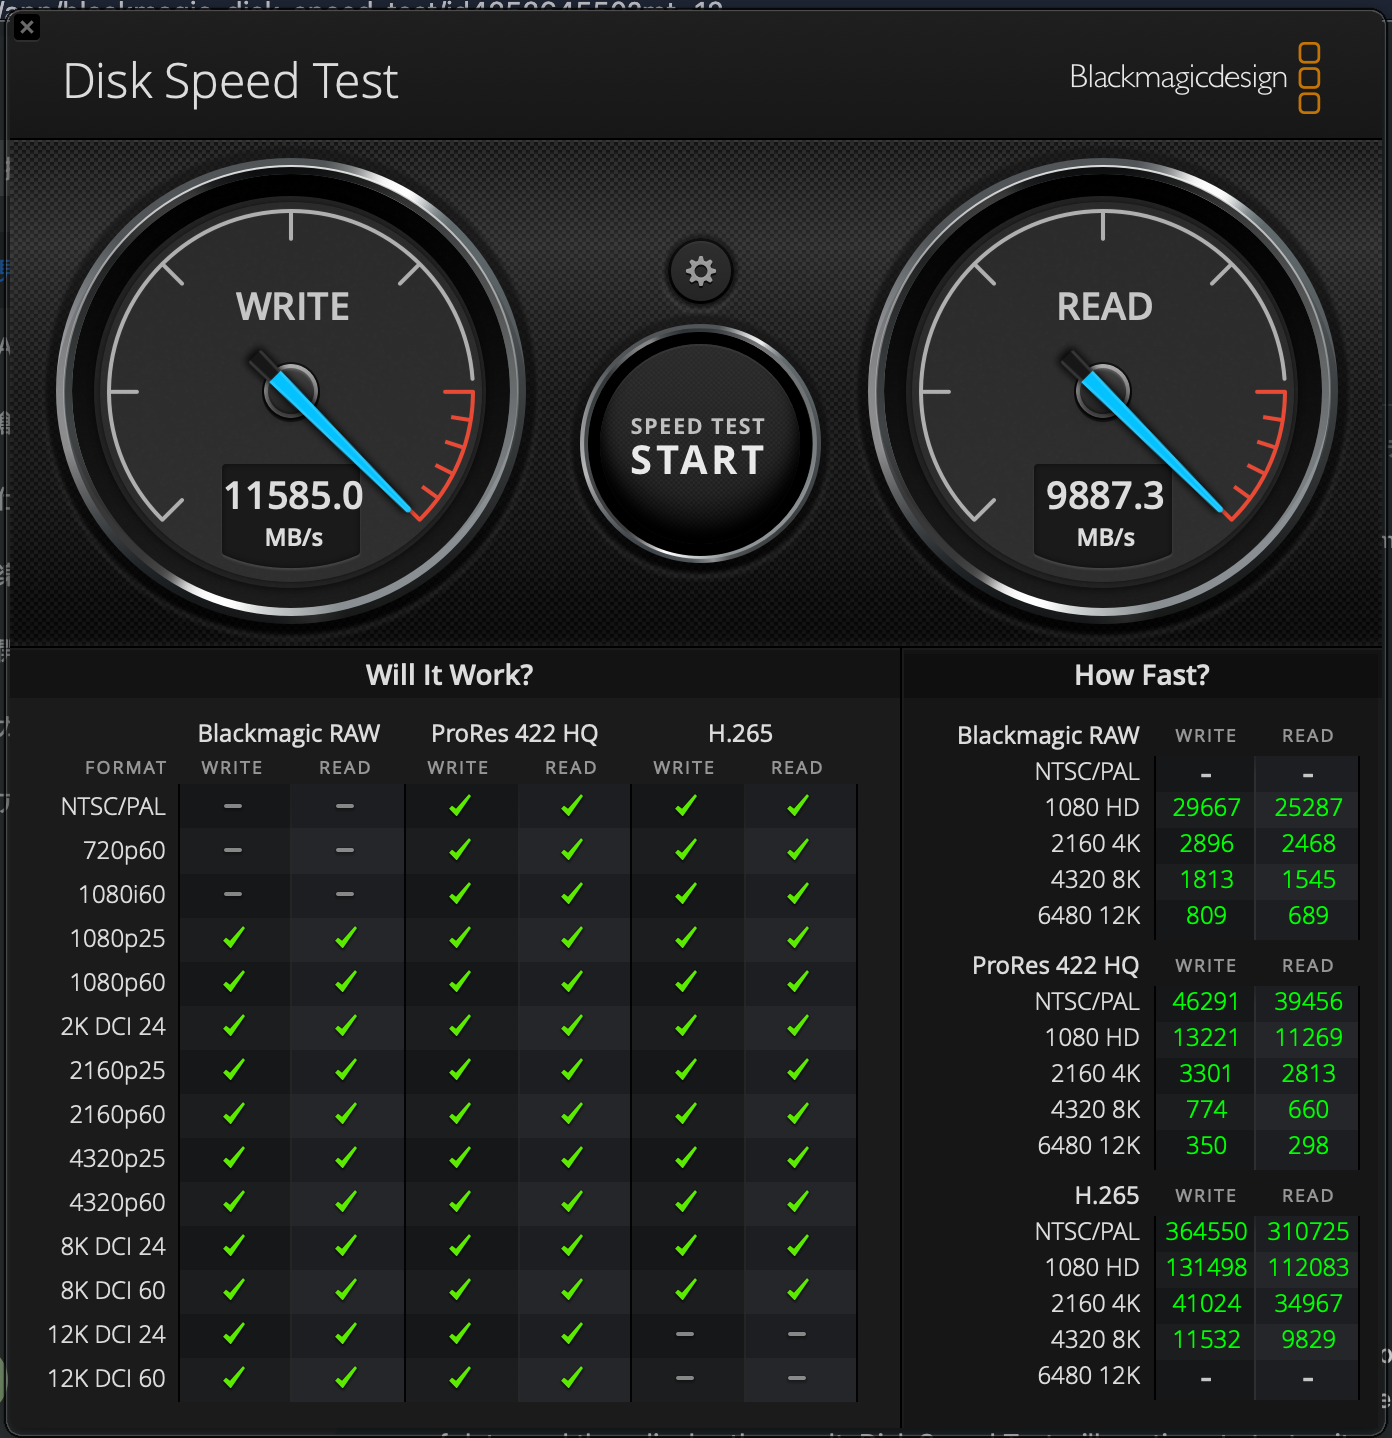
硬盘读写测试
| 左边为 M1 Pro,右边为 M5 Pro |
编译 Redis
本次使用的 Redis 源码为 https://github.com/redis/redis.git 仓库的 ee376cdc3cbf93428ee05829074fd83f33800f50 commit,make、gcc-15 版本如下:
$ make --version

GNU Make 3.81
Copyright (C) 2006  Free Software Foundation, Inc.
This is free software; see the source for copying conditions.
There is NO warranty; not even for MERCHANTABILITY or FITNESS FOR A
PARTICULAR PURPOSE.

This program built for i386-apple-darwin11.3.0

$ gcc-15 --version
gcc-15 (Homebrew GCC 15.2.0_1) 15.2.0
Copyright (C) 2025 Free Software Foundation, Inc.
This is free software; see the source for copying conditions.  There is NO
warranty; not even for MERCHANTABILITY or FITNESS FOR A PARTICULAR PURPOSE.
编译使用 make CC=gcc-15 -j$(sysctl -n hw.ncpu),结果如下:
-
M1 Pro:31s
-
M5 Pro:14s,提升 ≈ 54.8%
M1 Pro 使用的编译命令是 make CC=gcc-15 -j8,因为它不认 hw.ncpu
|
内存持续带宽测试
该测试使用的仓库为:jeffhammond/STREAM ,commit hash: 6703f7504a38a8da96b353cadafa64d3c2d7a2d3,编译命令为 clang -O3 -march=native -DSTREAM_ARRAY_SIZE=80000000 stream.c -o stream,clang 版本为 Apple clang version 17.0.0 (clang-1700.6.4.2)
M1 Pro 测试结果
-------------------------------------------------------------
STREAM version $Revision: 5.10 $
-------------------------------------------------------------
This system uses 8 bytes per array element.
-------------------------------------------------------------
Array size = 80000000 (elements), Offset = 0 (elements)
Memory per array = 610.4 MiB (= 0.6 GiB).
Total memory required = 1831.1 MiB (= 1.8 GiB).
Each kernel will be executed 10 times.
 The *best* time for each kernel (excluding the first iteration)
 will be used to compute the reported bandwidth.
-------------------------------------------------------------
Your clock granularity/precision appears to be 1 microseconds.
Each test below will take on the order of 155800 microseconds.
   (= 155800 clock ticks)
Increase the size of the arrays if this shows that
you are not getting at least 20 clock ticks per test.
-------------------------------------------------------------
WARNING -- The above is only a rough guideline.
For best results, please be sure you know the
precision of your system timer.
-------------------------------------------------------------
Function    Best Rate MB/s  Avg time     Min time     Max time
Copy:           90799.6     0.014164     0.014097     0.014238
Scale:          85504.0     0.015104     0.014970     0.015421
Add:            77814.9     0.025042     0.024674     0.026577
Triad:          77767.6     0.025286     0.024689     0.028325
-------------------------------------------------------------
Solution Validates: avg error less than 1.000000e-13 on all three arrays
-------------------------------------------------------------
M5 Pro 测试结果
-------------------------------------------------------------
STREAM version $Revision: 5.10 $
-------------------------------------------------------------
This system uses 8 bytes per array element.
-------------------------------------------------------------
Array size = 80000000 (elements), Offset = 0 (elements)
Memory per array = 610.4 MiB (= 0.6 GiB).
Total memory required = 1831.1 MiB (= 1.8 GiB).
Each kernel will be executed 10 times.
 The *best* time for each kernel (excluding the first iteration)
 will be used to compute the reported bandwidth.
-------------------------------------------------------------
Your clock granularity/precision appears to be 1 microseconds.
Each test below will take on the order of 41908 microseconds.
   (= 41908 clock ticks)
Increase the size of the arrays if this shows that
you are not getting at least 20 clock ticks per test.
-------------------------------------------------------------
WARNING -- The above is only a rough guideline.
For best results, please be sure you know the
precision of your system timer.
-------------------------------------------------------------
Function    Best Rate MB/s  Avg time     Min time     Max time
Copy:          135221.7     0.009498     0.009466     0.009575
Scale:         126695.2     0.010163     0.010103     0.010318
Add:           131896.4     0.014612     0.014557     0.014814
Triad:         132414.7     0.014581     0.014500     0.014835
-------------------------------------------------------------
Solution Validates: avg error less than 1.000000e-13 on all three arrays
-------------------------------------------------------------| 测试项 | M1Pro | M5Pro | 提升 |
|---|---|---|---|
Copy |
90799.6 MB/s |
135221.7 MB/s |
48.92% |
Scale |
85504.0 MB/s |
126695.2 MB/s |
48.17% |
Add |
77814.9 MB/s |
131896.4 MB/s |
69.50% |
Triad |
77767.6 MB/s |
132414.7 MB/s |
70.27% |
平均提升 ≈ 59.2%
rchase 内存随机访问测试
这里使用了 cyy 的项目:rchase,测试参数为 ./rchase 2048 10000000 ,连续测试五次
| 型号 | 最短时长 | 最长时长 | 平均值 |
|---|---|---|---|
M1Pro |
142.65 ns |
148.22 ns |
143.922 ns |
M5Pro |
118.56 ns |
120.61 ns |
119.43 ns |
硬盘随机读写测试
该测试使用 fio-3.41 进行,测试命令为 fio --name=randrw --filename=testfile --size=8G --bs=4k --rw=randrw --rwmixread=50 --iodepth=64 --ioengine=posixaio --direct=1 --runtime=60 --time_based
M1 Pro 测试结果
randrw: (g=0): rw=randrw, bs=(R) 4096B-4096B, (W) 4096B-4096B, (T) 4096B-4096B, ioengine=posixaio, iodepth=64
fio-3.41
Starting 1 process
randrw: Laying out IO file (1 file / 8192MiB)
Jobs: 1 (f=1): [m(1)][100.0%][r=71.5MiB/s,w=71.0MiB/s][r=18.3k,w=18.2k IOPS][eta 00m:00s]
randrw: (groupid=0, jobs=1): err= 0: pid=98424: Sun Mar 15 16:36:19 2026
  read: IOPS=18.6k, BW=72.7MiB/s (76.3MB/s)(4365MiB/60001msec)
    slat (nsec): min=0, max=173000, avg=3237.49, stdev=5154.97
    clat (usec): min=4, max=9319, avg=373.36, stdev=541.11
     lat (usec): min=5, max=9333, avg=376.60, stdev=541.00
    clat percentiles (usec):
     |  1.00th=[   15],  5.00th=[   55], 10.00th=[  121], 20.00th=[  143],
     | 30.00th=[  157], 40.00th=[  172], 50.00th=[  184], 60.00th=[  200],
     | 70.00th=[  221], 80.00th=[  253], 90.00th=[ 1631], 95.00th=[ 1827],
     | 99.00th=[ 2008], 99.50th=[ 2073], 99.90th=[ 2245], 99.95th=[ 2638],
     | 99.99th=[ 6915]
   bw (  KiB/s): min=56928, max=81240, per=100.00%, avg=74562.91, stdev=3114.78, samples=119
   iops        : min=14232, max=20310, avg=18640.41, stdev=778.68, samples=119
  write: IOPS=18.6k, BW=72.7MiB/s (76.2MB/s)(4362MiB/60001msec); 0 zone resets
    slat (nsec): min=0, max=779000, avg=3317.50, stdev=5354.93
    clat (usec): min=5, max=9375, avg=467.41, stdev=560.51
     lat (usec): min=10, max=9377, avg=470.73, stdev=560.39
    clat percentiles (usec):
     |  1.00th=[   53],  5.00th=[  141], 10.00th=[  174], 20.00th=[  202],
     | 30.00th=[  223], 40.00th=[  243], 50.00th=[  265], 60.00th=[  289],
     | 70.00th=[  322], 80.00th=[  392], 90.00th=[ 1713], 95.00th=[ 1909],
     | 99.00th=[ 2114], 99.50th=[ 2180], 99.90th=[ 3490], 99.95th=[ 3654],
     | 99.99th=[ 7046]
   bw (  KiB/s): min=56968, max=80334, per=100.00%, avg=74526.04, stdev=3033.21, samples=119
   iops        : min=14242, max=20083, avg=18631.12, stdev=758.29, samples=119
  lat (usec)   : 10=0.15%, 20=0.93%, 50=1.72%, 100=2.25%, 250=56.58%
  lat (usec)   : 500=24.67%, 750=1.23%, 1000=0.16%
  lat (msec)   : 2=10.34%, 4=1.94%, 10=0.03%
  cpu          : usr=9.39%, sys=251.26%, ctx=7351546, majf=0, minf=9
  IO depths    : 1=0.1%, 2=0.1%, 4=0.2%, 8=62.3%, 16=37.4%, 32=0.0%, >=64=0.0%
     submit    : 0=0.0%, 4=100.0%, 8=0.0%, 16=0.0%, 32=0.0%, 64=0.0%, >=64=0.0%
     complete  : 0=0.0%, 4=96.6%, 8=3.2%, 16=0.2%, 32=0.0%, 64=0.0%, >=64=0.0%
     issued rwts: total=1117407,1116754,0,0 short=0,0,0,0 dropped=0,0,0,0
     latency   : target=0, window=0, percentile=100.00%, depth=64

Run status group 0 (all jobs):
   READ: bw=72.7MiB/s (76.3MB/s), 72.7MiB/s-72.7MiB/s (76.3MB/s-76.3MB/s), io=4365MiB (4577MB), run=60001-60001msec
  WRITE: bw=72.7MiB/s (76.2MB/s), 72.7MiB/s-72.7MiB/s (76.2MB/s-76.2MB/s), io=4362MiB (4574MB), run=60001-60001msec
M5 Pro 测试结果
randrw: (g=0): rw=randrw, bs=(R) 4096B-4096B, (W) 4096B-4096B, (T) 4096B-4096B, ioengine=posixaio, iodepth=64
fio-3.41
Starting 1 process
randrw: Laying out IO file (1 file / 8192MiB)
Jobs: 1 (f=1): [m(1)][100.0%][r=128MiB/s,w=128MiB/s][r=32.8k,w=32.8k IOPS][eta 00m:00s]
randrw: (groupid=0, jobs=1): err= 0: pid=791: Sun Mar 15 16:25:02 2026
  read: IOPS=31.8k, BW=124MiB/s (130MB/s)(7460MiB/60001msec)
    slat (nsec): min=0, max=106000, avg=1901.73, stdev=3024.24
    clat (usec): min=3, max=7214, avg=226.38, stdev=339.14
     lat (usec): min=3, max=7218, avg=228.28, stdev=339.09
    clat percentiles (usec):
     |  1.00th=[   11],  5.00th=[   83], 10.00th=[   93], 20.00th=[  103],
     | 30.00th=[  112], 40.00th=[  119], 50.00th=[  126], 60.00th=[  135],
     | 70.00th=[  145], 80.00th=[  163], 90.00th=[  235], 95.00th=[ 1270],
     | 99.00th=[ 1434], 99.50th=[ 1467], 99.90th=[ 1598], 99.95th=[ 2376],
     | 99.99th=[ 4359]
   bw (  KiB/s): min=103808, max=139601, per=100.00%, avg=127384.36, stdev=6568.27, samples=119
   iops        : min=25952, max=34900, avg=31845.85, stdev=1642.07, samples=119
  write: IOPS=31.8k, BW=124MiB/s (130MB/s)(7451MiB/60001msec); 0 zone resets
    slat (nsec): min=0, max=152000, avg=1973.04, stdev=3180.62
    clat (usec): min=4, max=7338, avg=266.26, stdev=353.25
     lat (usec): min=6, max=7338, avg=268.24, stdev=353.20
    clat percentiles (usec):
     |  1.00th=[   28],  5.00th=[  102], 10.00th=[  116], 20.00th=[  128],
     | 30.00th=[  137], 40.00th=[  147], 50.00th=[  157], 60.00th=[  169],
     | 70.00th=[  184], 80.00th=[  210], 90.00th=[  318], 95.00th=[ 1319],
     | 99.00th=[ 1483], 99.50th=[ 1532], 99.90th=[ 1729], 99.95th=[ 2540],
     | 99.99th=[ 4817]
   bw (  KiB/s): min=105354, max=139691, per=100.00%, avg=127254.03, stdev=6323.81, samples=119
   iops        : min=26338, max=34922, avg=31813.21, stdev=1580.94, samples=119
  lat (usec)   : 4=0.01%, 10=0.47%, 20=0.93%, 50=1.77%, 100=7.02%
  lat (usec)   : 250=78.39%, 500=2.66%, 750=0.04%, 1000=0.02%
  lat (msec)   : 2=8.61%, 4=0.07%, 10=0.01%
  cpu          : usr=12.65%, sys=249.01%, ctx=10271579, majf=0, minf=9
  IO depths    : 1=0.1%, 2=0.1%, 4=0.4%, 8=59.8%, 16=39.8%, 32=0.0%, >=64=0.0%
     submit    : 0=0.0%, 4=100.0%, 8=0.0%, 16=0.0%, 32=0.0%, 64=0.0%, >=64=0.0%
     complete  : 0=0.0%, 4=97.1%, 8=2.7%, 16=0.2%, 32=0.0%, 64=0.0%, >=64=0.0%
     issued rwts: total=1909637,1907506,0,0 short=0,0,0,0 dropped=0,0,0,0
     latency   : target=0, window=0, percentile=100.00%, depth=64

Run status group 0 (all jobs):
   READ: bw=124MiB/s (130MB/s), 124MiB/s-124MiB/s (130MB/s-130MB/s), io=7460MiB (7822MB), run=60001-60001msec
  WRITE: bw=124MiB/s (130MB/s), 124MiB/s-124MiB/s (130MB/s-130MB/s), io=7451MiB (7813MB), run=60001-60001msec
Web 渲染性能测试 (Speedometer3.0)
测试地址:Speedometer 3,着急出门测完才发现首页建议使用 Speedometer 3.1
M1 Pro 测试结果
TodoMVC-JavaScript-ES5  33.14 ± 1.87 (5.6%) ms
TodoMVC-JavaScript-ES6-Webpack-Complex-DOM  37.25 ± 4.77 (12.8%)  ms
TodoMVC-WebComponents 13.64 ± 1.38 (10.1%)  ms
TodoMVC-React-Complex-DOM 27.23 ± 2.08 (7.6%) ms
TodoMVC-React-Redux 28.60 ± 2.89 (10.1%)  ms
TodoMVC-Backbone  20.75 ± 1.11 (5.4%) ms
TodoMVC-Angular-Complex-DOM 25.02 ± 1.88 (7.5%) ms
TodoMVC-Vue 18.01 ± 2.42 (13.4%)  ms
TodoMVC-jQuery  95.79 ± 7.86 (8.2%) ms
TodoMVC-Preact-Complex-DOM  11.05 ± 1.03 (9.3%) ms
TodoMVC-Svelte-Complex-DOM  9.45  ± 0.90 (9.5%) ms
TodoMVC-Lit-Complex-DOM 12.53 ± 0.87 (6.9%) ms
NewsSite-Next 65.56 ± 3.96 (6.0%) ms
NewsSite-Nuxt 51.96 ± 3.42 (6.6%) ms
Editor-CodeMirror 20.09 ± 4.97 (24.7%)  ms
Editor-TipTap 55.42 ± 5.38 (9.7%) ms
Charts-observable-plot  38.99 ± 4.02 (10.3%)  ms
Charts-chartjs  36.75 ± 6.83 (18.6%)  ms
React-Stockcharts-SVG 63.34 ± 6.91 (10.9%)  ms
M5 Pro 测试结果
TodoMVC-JavaScript-ES5  19.20 ± 2.78 (14.5%)  ms
TodoMVC-JavaScript-ES6-Webpack-Complex-DOM  19.45 ± 1.93 (9.9%) ms
TodoMVC-WebComponents 8.76  ± 2.05 (23.4%)  ms
TodoMVC-React-Complex-DOM 17.41 ± 2.58 (14.8%)  ms
TodoMVC-React-Redux 17.57 ± 2.60 (14.8%)  ms
TodoMVC-Backbone  12.51 ± 2.32 (18.5%)  ms
TodoMVC-Angular-Complex-DOM 16.03 ± 1.85 (11.6%)  ms
TodoMVC-Vue 11.62 ± 1.70 (14.6%)  ms
TodoMVC-jQuery  61.52 ± 11.84 (19.2%) ms
TodoMVC-Preact-Complex-DOM  7.02  ± 0.80 (11.4%)  ms
TodoMVC-Svelte-Complex-DOM  6.38  ± 0.87 (13.6%)  ms
TodoMVC-Lit-Complex-DOM 8.17  ± 1.04 (12.7%)  ms
NewsSite-Next 37.84 ± 1.89 (5.0%) ms
NewsSite-Nuxt 31.13 ± 3.17 (10.2%)  ms
Editor-CodeMirror 12.93 ± 3.56 (27.5%)  ms
Editor-TipTap 36.06 ± 5.94 (16.5%)  ms
Charts-observable-plot  24.34 ± 3.79 (15.6%)  ms
Charts-chartjs  23.29 ± 5.89 (25.3%)  ms
React-Stockcharts-SVG 39.33 ± 4.11 (10.5%)  ms
Perf-Dashboard 16.76 ± 1.57 (9.4%) ms| 测试项 | M1Pro | M5Pro | 提升 |
|---|---|---|---|
TodoMVC-JavaScript-ES5 |
33.14 ms |
19.20 ms |
42.06% |
TodoMVC-JavaScript-ES6-Webpack-Complex-DOM |
37.25 ms |
19.45 ms |
47.79% |
TodoMVC-WebComponents |
13.64 ms |
8.76 ms |
35.78% |
TodoMVC-React-Complex-DOM |
27.23 ms |
17.41 ms |
36.06% |
TodoMVC-React-Redux |
28.60 ms |
17.57 ms |
38.57% |
TodoMVC-Backbone |
20.75 ms |
12.51 ms |
39.71% |
TodoMVC-Angular-Complex-DOM |
25.02 ms |
16.03 ms |
35.93% |
TodoMVC-Vue |
18.01 ms |
11.62 ms |
35.48% |
TodoMVC-jQuery |
95.79 ms |
61.52 ms |
35.77% |
TodoMVC-Preact-Complex-DOM |
11.05 ms |
7.02 ms |
36.47% |
TodoMVC-Svelte-Complex-DOM |
9.45 ms |
6.38 ms |
32.49% |
TodoMVC-Lit-Complex-DOM |
12.53 ms |
8.17 ms |
34.80% |
NewsSite-Next |
65.56 ms |
37.84 ms |
42.29% |
NewsSite-Nuxt |
51.96 ms |
31.13 ms |
40.08% |
Editor-CodeMirror |
20.09 ms |
12.93 ms |
35.64% |
Editor-TipTap |
55.42 ms |
36.06 ms |
34.93% |
Charts-observable-plot |
38.99 ms |
24.34 ms |
37.57% |
Charts-chartjs |
36.75 ms |
23.29 ms |
36.63% |
React-Stockcharts-SVG |
63.34 ms |
39.33 ms |
37.91% |
Perf-Dashboard |
- |
16.76 ms |
- |
浏览器中,M5 Pro 相比于 M1 Pro,平均提升 ≈ 38.6%
编译 llvm
源码来自 https://github.com/llvm/llvm-project.git 的 8c84b3c4e28a2756f52295f21ef67e97bae000a1 commit
依赖版本如下:
-
cmake 4.2.3
-
ninja 1.13.2
配置、编译过程如下方命令:
$ git clone https://github.com/llvm/llvm-project.git --depth=1
$ cd llvm-project
$ mkdir build && cd build
$ cmake -G Ninja ../llvm \
  -DCMAKE_BUILD_TYPE=Release \
  -DLLVM_ENABLE_PROJECTS="clang;clang-tools-extra;lld;mlir" \
  -DCMAKE_INSTALL_PREFIX=/usr/local/llvm
$ ninja -j$(sysctl -n hw.ncpu)
最终结果 (时间数据来自 zsh 的 Powerlevel10K 主题):
-
M1 Pro:32m 26s
-
M5 Pro:13m 11s,提升 ≈ 59.35%
复合 maven 工程测试
这是我司的 Java 后端工程,包括但不限于 cli、SpringBoot 等微服务,测试命令使用 mvn -T 1C -U -B -DskipTests -Dmaven.test.skip=true clean verify
测试条件
$ mvn --version
Apache Maven 3.9.14 (996c630dbc656c76214ce58821dcc58be960875b)
Maven home: /opt/homebrew/Cellar/maven/3.9.14/libexec
Java version: 21.0.10, vendor: Homebrew, runtime: /opt/homebrew/Cellar/openjdk@21/21.0.10/libexec/openjdk.jdk/Contents/Home
Default locale: zh_US_#Hans, platform encoding: UTF-8
OS name: "mac os x", version: "26.3.1", arch: "aarch64", family: "mac"
测试结果:
-
M1 Pro:Total time: 12.938 s (Wall Clock)
-
M5 Pro:Total time: 5.792 s (Wall Clock),提升 ≈ 55.23%
ANE 神经网络引擎
本次测试使用仓库:anemll-bench
| 此仓库对于 M1 Pro 芯片认为没必要跑额外的 dual model 测试 |
M1 Pro
  标准 ANE benchmark 结果:
  - llama_lm_head: 19.11ms, 54.99 GB/s
  - llama_lm_head_lut6, 8.52ms, 46.51 GB/s
  - DeepHermes_lm_head, 19.10ms, 55.01 GB/s
M5 Pro
  标准 ANE benchmark 结果:

  - llama_lm_head: 6.99 ms, 150.38 GB/s
  - llama_lm_head_lut6: 3.66 ms, 108.12 GB/s
  - DeepHermes_lm_head: 7.01 ms, 149.80 GB/s

  Dual-model benchmark 结果:

  - 单跑:llama_lm_head 6.99 ms / 150.24 GB/s,DeepHermes_lm_head 6.99 ms / 150.30 GB/s
  - 并行:14.05 ms / 74.77 GB/s 和 14.03 ms / 74.90 GB/s
  - 合并吞吐:149.54 GB/s
  - 效率:49.76%
游戏
这部分测试 M1 Pro 不参与
Java 原版 Minecraft
此处使用了 HMCL 启动器,版本 3.9.1,游戏组件版本如下:
-
Minecraft 1.21.11
-
Forge 61.1.3
-
Sodium 0.8.6
详细的统计信息:
基本性能
-
帧率:约 115 FPS
-
垂直同步:关闭
-
最大帧率限制:无限制
-
全屏:关闭
-
当前分辨率:当前系统分辨率 (系统设置 → 显示器 → 更多空间后窗口最大化)
渲染与模拟
-
渲染距离:32 区块
-
模拟距离:32 区块
-
实体渲染距离:100%
-
区块构建器:线程化
图形质量
-
生物群系过渡距离:15×15(最高)
-
平滑光照:开启
-
云:高品质
-
云层距离:128 区块
-
实体阴影:开启
-
粒子效果:全部
-
天气效果半径:10 方块
-
Mipmap 级别:4
-
各向异性过滤:4×
-
纹理过滤:无
调试信息(F3)
-
XYZ:88.856 / 63 / -53.657
-
Block:88 63 -54
-
Facing:West
-
Chunk:5 3 -4
内存使用
-
已使用内存:1465 MB / 6144 MB(约 23%)
-
已分配堆:2368 MB(约 30%)
-
内存分配速率:约 141 MB/s
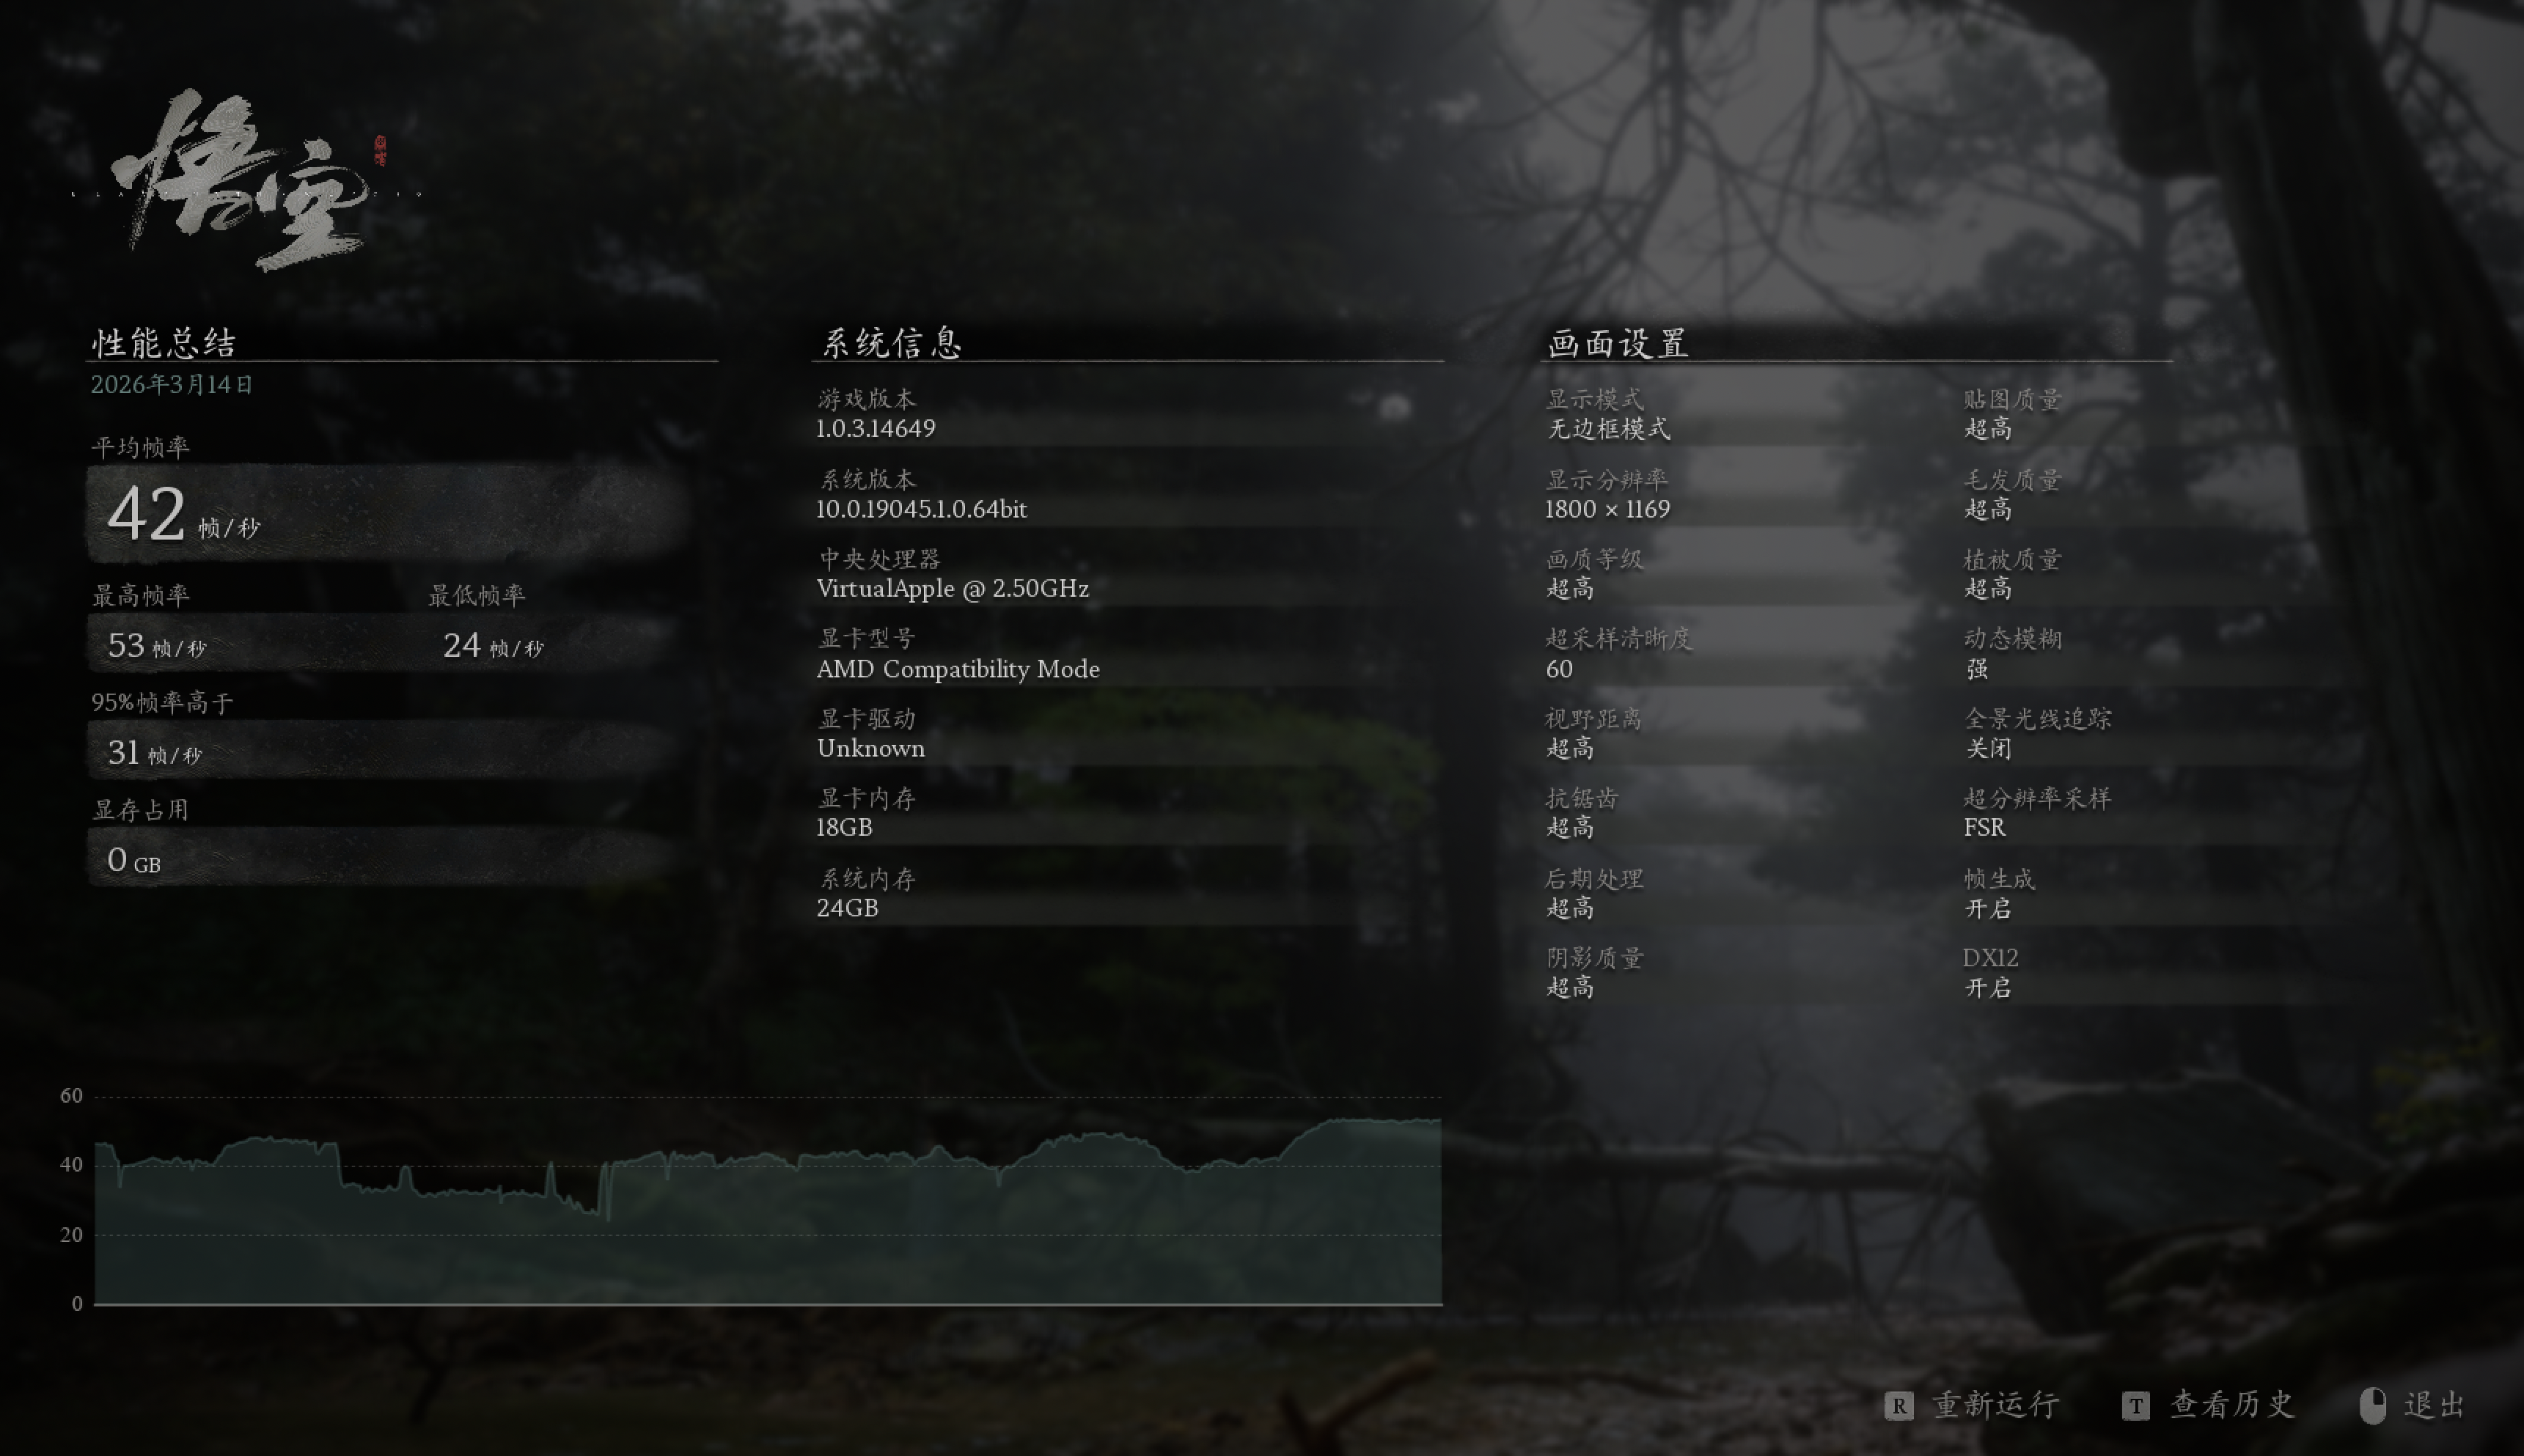
黑神话:悟空 性能测试工具 (运行在 CrossOver)
测试条件和结果如图:
总结
| 此部分由 LLM 撰写 |
从整篇测试看,M5 Pro 对 M1 Pro 并不是一次“小修小补”,而是一次比较完整的代际跃迁。即便本文里给 M5 Pro 额外叠了散热、后台进程和供电条件上的 Debuff,它依然在绝大多数项目里稳定拉开差距:Cinebench GPU 从 9789 提升到 40175,接近 4.1 倍;CPU 多核从 2634 提升到 7702,约 2.9 倍;单核也从 442 提升到 738,约 1.67 倍。这说明它不只是峰值更高,单线程响应和并行吞吐都上了一个明显的台阶。
如果工作负载以“干活”为主,升级收益是最直观的。ffmpeg 视频合成从 6 分 33 秒缩短到 2 分 45 秒,Redis 编译从 31 秒降到 14 秒,llvm 全量编译从 32 分 26 秒降到 13 分 11 秒,复合 Maven 工程也从 12.938 秒降到 5.792 秒,整体都落在约 55% 到 60% 的缩短区间。换句话说,M5 Pro 带来的不是零散的小优化,而是每次构建、每次转码都能感知到的时间回收。
本地 AI 相关任务的提升也很实在。LM Studio 下,gemma-3-4b 的生成速度从 49.03 提升到 96.79 Token/s,qwen3.5-9b 从 16.2 提升到 34.78 Token/s,TTFT 也分别从 0.83s 降到 0.24s、1.32s 降到 0.71s;ANE 测试里,llama_lm_head 延迟从 19.11 ms 降到 6.99 ms,吞吐从 54.99 GB/s 提高到 150.38 GB/s。对于本地模型推理、代码补全、agent 类工作流来说,这种提升会直接反映在“等输出”的时间上。
内存与存储部分虽然没有 GPU 跑分那么夸张,但同样属于全线抬升。STREAM 平均带宽提升约 59.2%,rchase 随机访问平均延迟从 143.922 ns 降到 119.43 ns,4K 随机混合读写从 72.7 MiB/s / 18.6k IOPS 提升到 124 MiB/s / 31.8k IOPS,读写平均延迟也有明显改善。这些指标未必像 Cinebench 那样醒目,但会实打实地体现在大型工程、索引、依赖解析和多任务切换的体验里。
相对更克制的一项是浏览器渲染。Speedometer 3.0 的平均提升约为 38.6%,已经足够让页面交互、前端开发和复杂后台页更顺滑,但它的变化确实没有编译、视频处理和本地 AI 这么夸张。所以如果只看结论:M1 Pro 到今天依然不是不能用,但只要日常负载里有频繁编译、视频转码、本地模型或更重的并行任务,M5 Pro 就已经不只是“锦上添花”,而是能持续兑现到每天工作流里的升级。
Licensed under Anti-996 License 1.0
本文链接:https://epliar.com/articles/m1-pro-and-m5-pro-benchmark/